

What's Going On in This Graph?

© 2020 The New York Times Company
Professor Emerita Partners with The New York Times on Statistics Education Feature
Professor Emerita Roxy Peck shares her insights and experiences editing The New York Times’ educational feature “What’s Going On in This Graph?,” which brings statistics education to children of all ages.
What is “What’s Going On in This Graph?”
What’s Going On in This Graph is a partnership between The New York Times and the American Statistical Association. Each week during the school year, a graphical display that appeared in The New York Times is released and students of all ages are invited to think about what they can learn from the graph. They are asked to notice and wonder, to think about how the graph is relevant to them and their community, and to write a catchy headline that they think captures the information in the graph.
This feature, part of the New York Times Learning Network, exposes students to a variety of different graphical displays and contexts, and allows them to reason about real world data that is displayed visually.
Students are able to post comments online at any time, and on Wednesday mornings there is an online moderated discussion where students can post comments, discuss with other students, and receive feedback from the moderators. The day following the online discussion, a “Reveal” is posted that includes a link that gives students free access to the full article where the graph appeared and also includes further discussion of the graph, some additional questions for students to consider, and “Stat Nuggets” which detail the statistics concepts that can be explored using the graph.
How did you get involved in What’s Going On in This Graph?
I have worked with the American Statistical Association on a number of statistics education projects over the years and was very happy when they asked me if I would help out with this project. Being able to think carefully about how data can be displayed visually and what can be communicated through visual displays is a skill that has become a necessary component of statistical literacy. I felt that time spent working on a project that had the potential to make meaningful contributions to students’ development of statistical literacy by asking them to reason about real-world data would be time well spent.
I work with two other people as editors of the feature, and we select the graphs and draft the Reveal and Stat Nuggets for each week’s graph. We also work with a large team of teachers who serve as moderators for the online discussions of each graph.
What are some of your favorite graphs and why?
Here are two of my favorite graphs:
© 2020 The New York Times Company
Why I like this emissions graph: It is a variation of a graph that students would be familiar with (a scatterplot), but rather than just displaying data on two numerical variables, it has incorporated two other variables—the type of car (electric, hybrid, etc.) by using color and car model by labeling points. Noticing and wondering about this graph requires students to think about more than two variables, helping to develop multivariable thinking. And I like it because it addresses the impact of cars on the environment and also asks students to challenge the common belief that electric cars, which have lower carbon dioxide emissions, are more expensive to own and operate.
© 2020 The New York Times Company
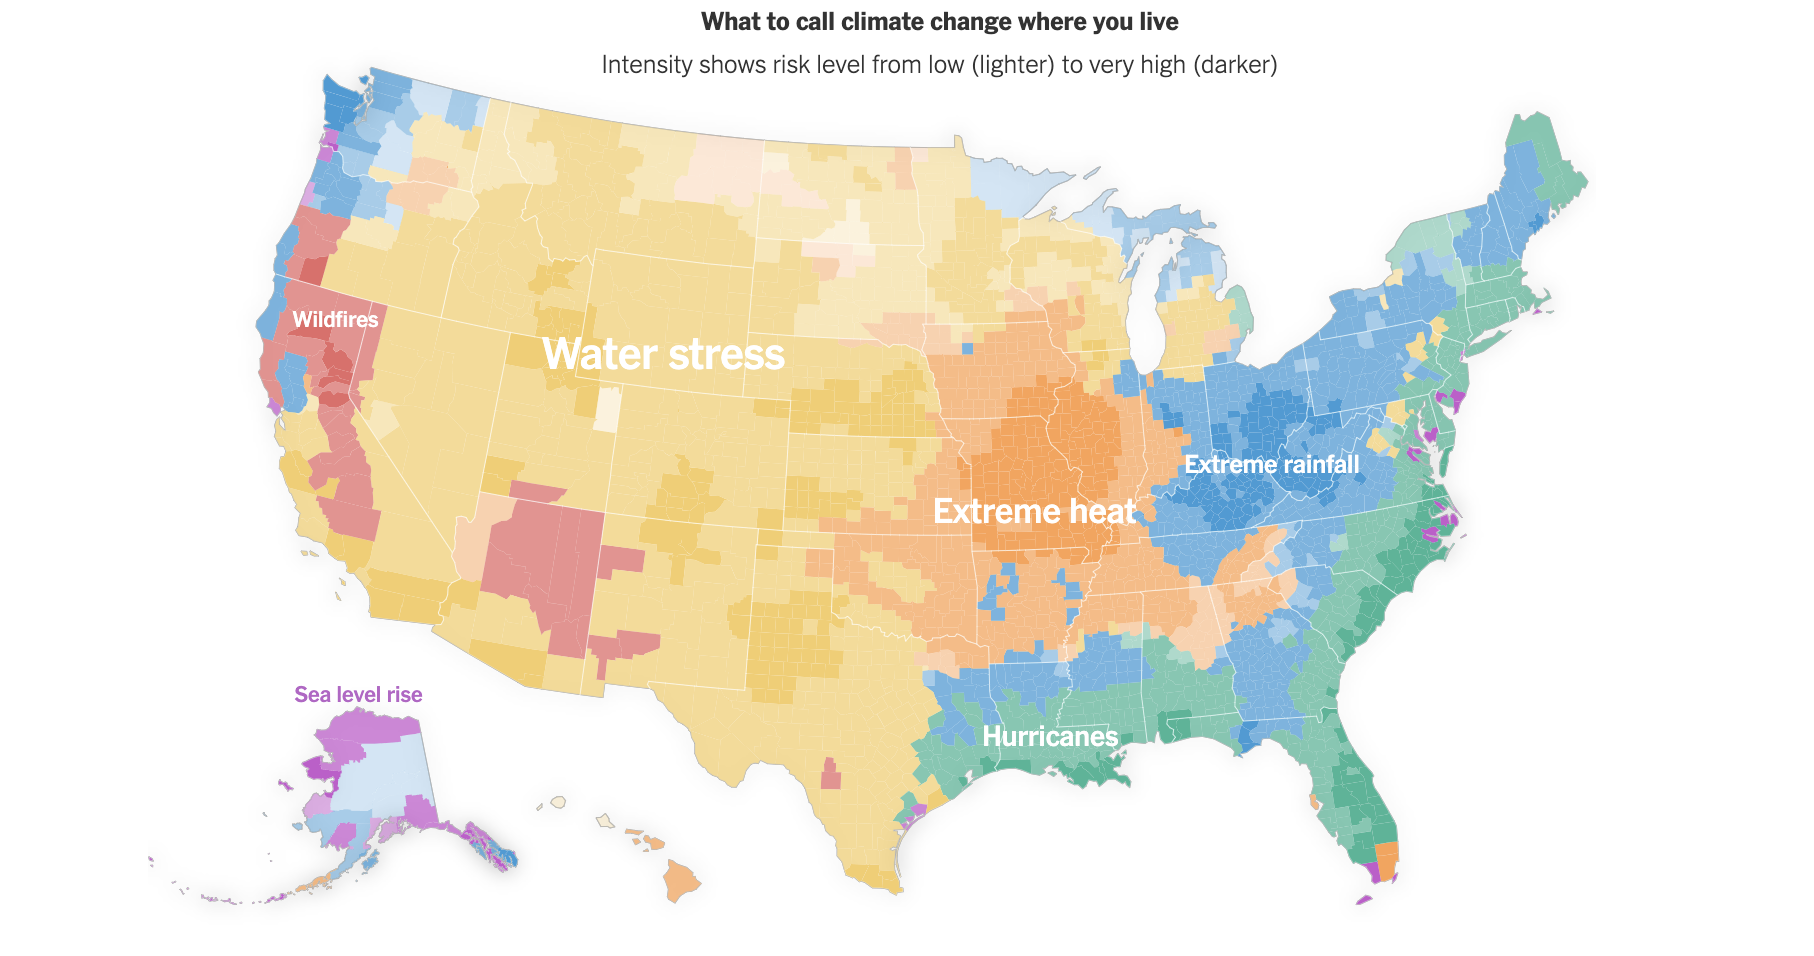
Why I like this climate change graph: It is a type of graphical display that students don’t usually see in class. Data visualizations that incorporate geographical information by displaying data on a map are becoming very common in the media, and it is helpful for students to see these kinds of graphs. This graph has students think about the different effects of climate change and how that varies by region of the country through its use of color. It also incorporates the degree of risk by varying the intensity of the color.
How are the graphs being used?
The graphs are being used in a variety of ways. Many K-12 teachers have their students consider each week’s graph and participate in the online discussion. The feature began in 2017, and by the end of this school year, there will have been 126 graphs featured and more than 110 Stat Nuggets addressed in the Reveals for those graphs. There have been over 38,000 student responses in the online discussions.
In addition, many more K-12 and university teachers are using the graphs as part of their classroom instruction. All of the graphs are part of an archive that can be searched by type of graph, context addressed — such as environment, health and wellness, and income inequality — and statistics topic, so teachers are turning to the archive as a source of current, relevant examples for use in their classrooms. Because the graphical displays are also often multivariable, teachers are finding them to be a great resource for examples that provide students with opportunities to develop multivariable thinking as well as graphical literacy. Although we don’t have an exact number, we estimate that there have been more than 800,000 visits to the feature’s website.
How might Cal Poly statistics alumni want to interact with these graphs?
Many of our alumni are now teaching at the K-12 and university level, and if they are not familiar with this feature it will be worth exploring it as a resource to support their teaching. Others may be interested in seeing all of the creative ways that multivariable data can be displayed and communicated visually. The New York Times has some very talented graphic designers who are able to create visually appealing graphs that are an honest representation of the underlying data (not always the case with graphical displays in the media!).
Those with school age children might consider asking their kids to notice and wonder about a graph that they think would be meaningful to them. Or consider volunteering to visit your local middle or high school to lead a discussion of a favorite graph!
Any ideas on what’s coming next?
What’s Going On in This Graph? has been seeing increasing participation every year since it began, and both The New York Times and the American Statistical Association are committed to continuing to offer this resource. I am looking forward to continuing the search for interesting visual displays and meaningful contexts that will encourage students and teachers to engage with and learn from data.
